Midterm – Mapping 1900’s Female Artists
For my midterm project I created a map showing where female artists in the Tate
For my midterm project I created a map showing where female artists in the Tate
For this project, I showcased the works of Alberto Giacometti using Omeka. https://shawnz.sites.carleton.edu/midterm/admin/
For my project, I did a data visualization of the British Tate museum art and
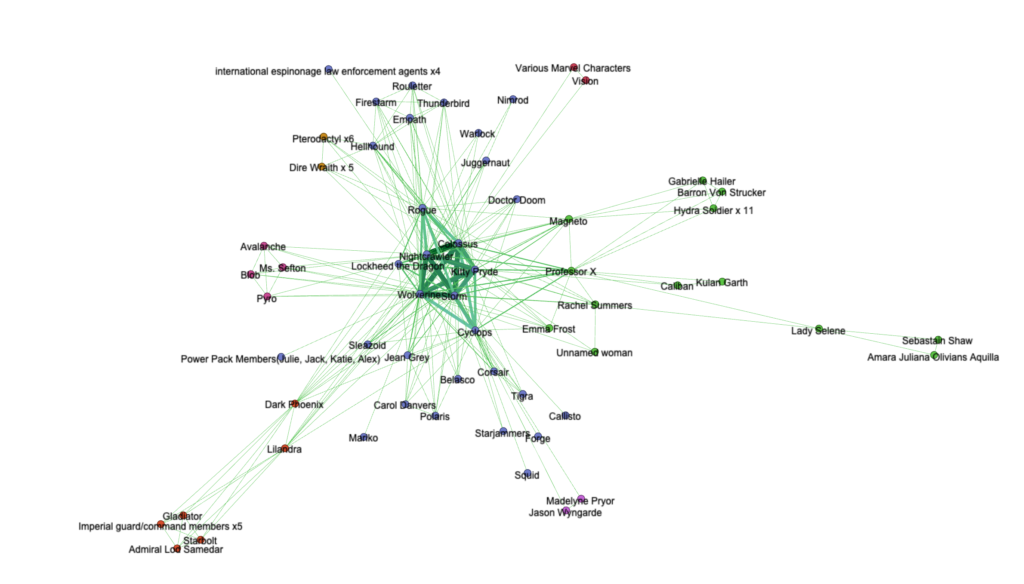
For my project used network analysis to visualize the relationships between X-Men characters. Edges were
FIRST ATTEMPT: Network Analysis *note: after working with this CSV data, I determined it was
I created a map of Mark Twain’s speeches and analyzed the text within them through
I did textual analysis in the form of topic modeling on a dataset containing speeches
For my project, I created a word cloud showing the frequency at which different words
My project (https://midterm.zhangx3.sites.carleton.edu/) introduces movements of Tate gallery artists who are born between 1900 and