Arb Through The Years Final Project
For our final project we created an interactive timeline with maps of Carleton’s Arboretum throughout
For our final project we created an interactive timeline with maps of Carleton’s Arboretum throughout
GitHub is an online platform that hosts code and data using the version control Git.
Right now, we are gathering information about the history of Carleton’s Arboretum for our timeline
Of all the topics we learned this term, georeferencing and GIS have been the most
For my project, I did a data visualization of the British Tate museum art and
This week we learned about GIS mapping. I didn’t have much experience in spatial humanities
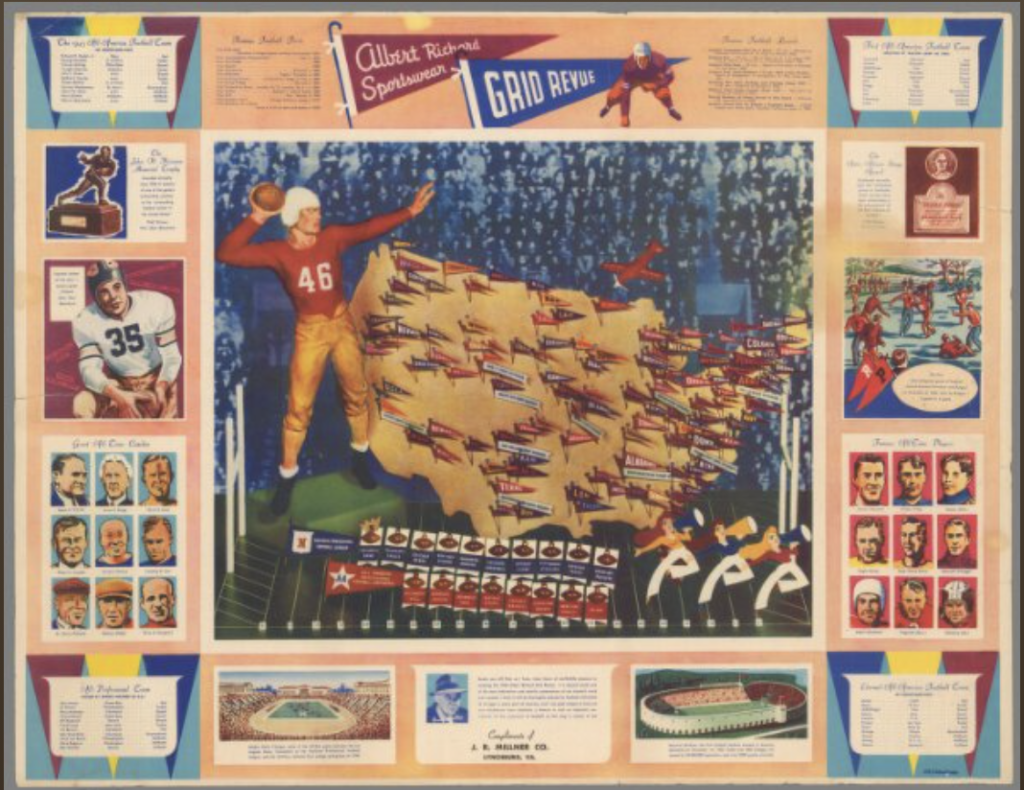
This week we looked at the David Rumsey Map Collection and learned to rectify the
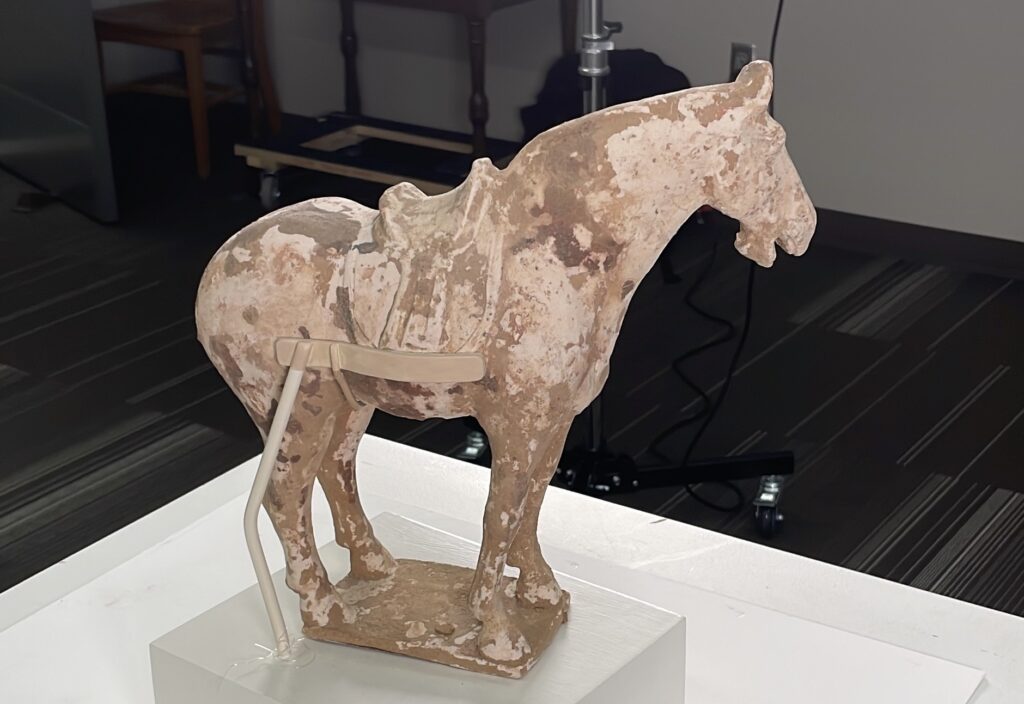
This week we spent time exploring photogrammetry and how it can be used to easily
I found Lin’s presentation in class regarding data visualization really interesting as well as topical
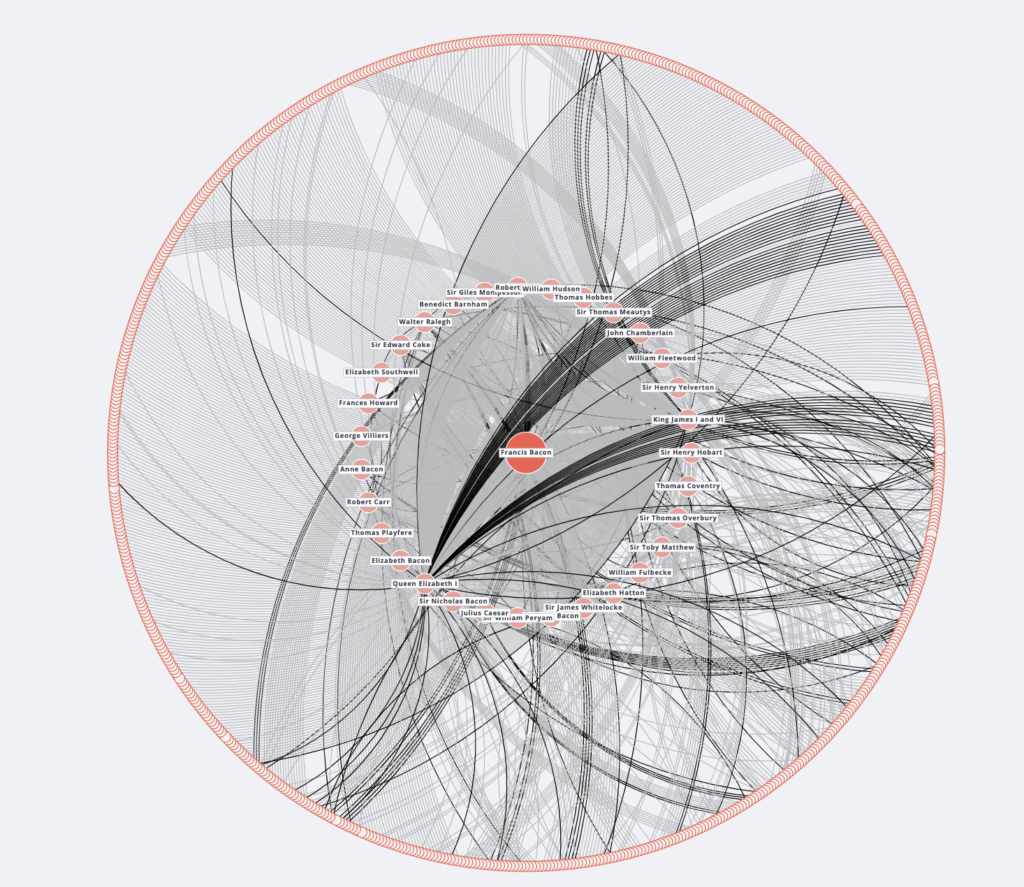
This network graph Six Degrees Of Francis Bacon shows the social network of Francis Bacon, the English