Final Project Data Visualization: Mapping Carleton Throughout the Years
What’s the data? The data is many maps of the Carleton Arboretum through the years.
What’s the data? The data is many maps of the Carleton Arboretum through the years.
There are many reasons why one may want to visualize hierarchical data. A popular way
My personal interest in this project is getting to use many of the fun tools
I did textual analysis in the form of topic modeling on a dataset containing speeches
Group Members: Jayti Arora, Connor Flinn, Quoc Nguyen, Aishwarya Varma, Evie LeDuc Project Topic Our
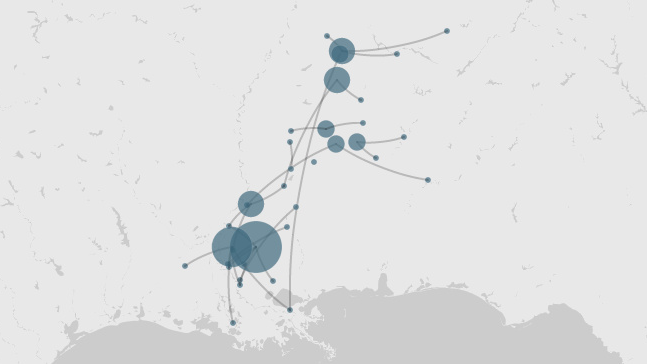
First off, just looking at an embeded map like the one above is suggestive of
This week we took a plunge into completely new waters for me. In some sense,
I have already really been enjoying this course for the past few weeks. It connects
Over the course of this term, I’ve come to respect and develop an incredibly deep
This week’s topic of networks/graphs was a nice refresher on a topic that I’ve learned