Intro
I explored Rhythm of Food, which aims to explore hidden search patterns in Google Searches about food. Food is a huge part of our cultural worldview. By exploring these search trends over the most widely used search tool in the United States (and the world), we can gain lots of insight into cultural and religious practices.
Sources / Processes
These researchers used Google Trends to analyze Google search data within their specified timeframe (2004-2018). They used Google Knowledge Graph topics, which is a knowledge base that serves some relevant information from google searches and focused on food trends only throughout the United States. Additionally, they utilized many recipes, ingredients, and food-based databases to supplement their analysis. More specifically, they use trend scores, which display Google users’ interest in whatever food topic, as a metric. The higher the score, the more interest in that food topic.
Presentation
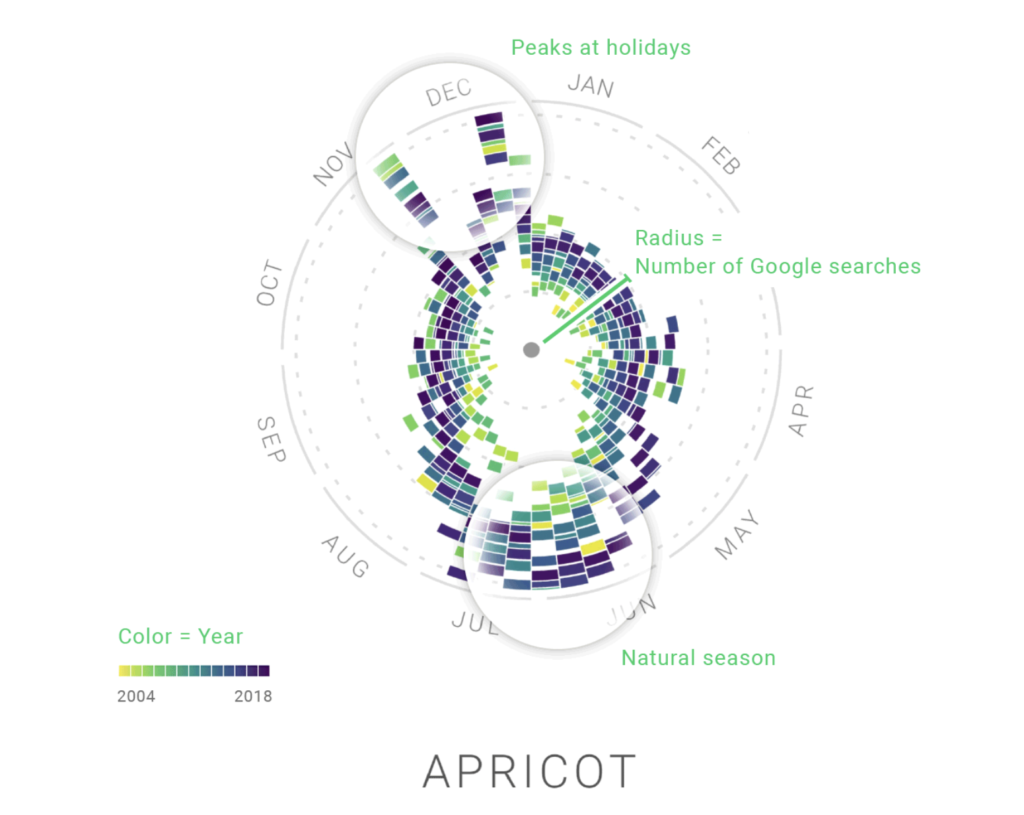
While there are quite a few ways to sort and refine the food trend data, the data visualizations look the same. For example, users are able to view the frequency of food trends and their popularity during certain months of the year. Most interestingly, they can view graphs that actually look like the food themselves.
The display is pretty intuitive and navigable. Additionally, users can view little blurbs explaining trends and learn fun facts about the foods and their ingredients. For example, one might ask themselves why Mint Julep is so popular in early May. This cocktail is actually the official drink of the Kentucky Derby, a horse race that runs at that time.
Summary
If I were to question further, I would ask the researchers how they might add to this project in the future. I think that this service has some pretty neat data visualizations, and it’s possible that it can do some more interesting things.
Target Audience: I think the target audience is everyone– anyone could use this tool. It could be used by other researchers, professors studying food, and students, but I also think it’s a fun tool that could be used by anyone.
Open Source: This project is definitely open source, as it uses google trend data, which is free and accessible. Someone else could probably easily reproduce this project without fees.