“Inventing Abstraction” by MoMA portrays the key episodes of the rise of abstraction, which are the results of collaboration among many pioneers. The project displays the productive relationship among those contributing artists, composers, poets, and dancers, aiming to track the development and connections of different works across disciplines.
Nodes and Edges
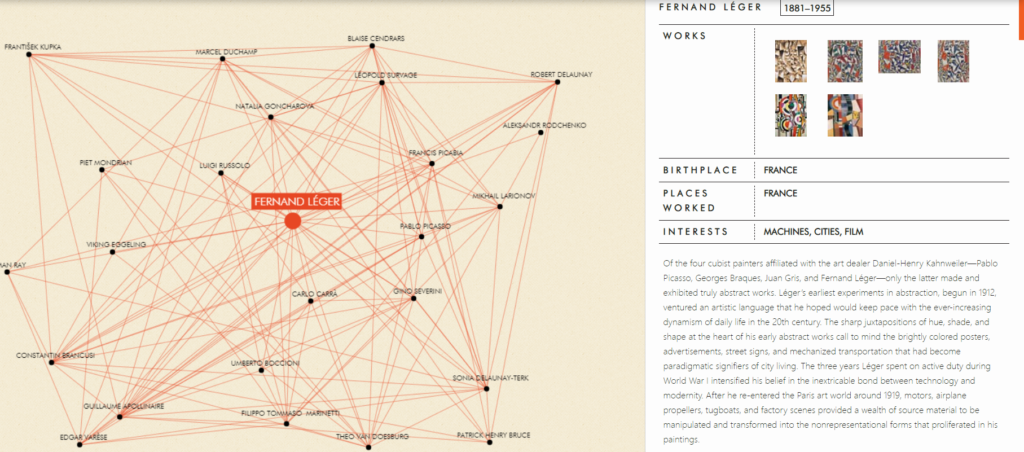
In the network, each node represents an artist who contributes to the abstraction movement in the time period (1910-1925). The red nodes indicate the artists with over 24 connections within the network and the black nodes indicate those with less than 24 connections. Each edge represents that the two adjacent artists have a relationship (documented acquaintance) with each other, such as those who have shared studios and even slept together.

Interaction
There is also a section where all the artists are listed in alphabetical order. Thus the audience could look up an artist quickly and view the information associated with them.
When hovering the mouse over an artist, the connections of the artist will be bolded. It allows the viewer to see the connections more clearly out of the complicated network. Moreover, when clicking on a node, the page for the artist represented by that node will be displayed (Fig 1). Here, viewers could see the detailed description of the artist, the works, and their interests. The project has a page for each work with year, caption, and introduction, and will be shown once the user clicks on the work on the artist page. This design is engaging because it allows the viewers to see the big picture, but also explore and get more information as they wanted.
Creation of the Project
Although there is no public documentation on the specific tools or data manipulation used, the project involves digitalization of the artworks, coding the artists’ information and analysis on literature to find connections. Different techniques must be involved in this process.