Mapping Prejudice is a project created through the University of Minnesota that aims to expose structural racism in the Twin Cities area by mapping racial covenants. These covenants became common after 1926 and were written into legally enforced property deeds; they restricted property owners from mortgaging, leasing, or selling their property to non-White people.
Practices such as racial covenants and redlining directly caused the racial segregation we see today, as the Twin Cities holds the largest housing disparity between White and Black homeownership of any major metropolitan area in the United States. Mapping Prejudice provides users with an open-access site that specifically aims to educate the broader public about the effects of racist policies. The site also provides researchers with a streamlined source of comprehensive data on racial covenants, which they can use to explore impacts on communities today.
Sources:
The Mapping Prejudice Project was created by a team of historians, geographers, librarians, digital humanists, and community activists at the University of Minnesota. The data for this project was sourced from historical property records between 1900 and 1960 within Hennepin and Ramsey counties. So far, the map is compiled of over 26,000 racial covenants.
Processes:
A methodology was developed to transcribe historical property deed information into a map using optical character recognition and crowdsourcing. Data used in the project was highly vetted. Optical character recognition was used to identify records that likely contained a racial covenant; these documents were then uploaded to Zooniverse, where they were transcribed by five different volunteers and checked using Cohen’s kappa statistic. Data entered by volunteer scores that did not pass the threshold was dropped from the project. All resulting data was entered into a map based on location.
Presentation:
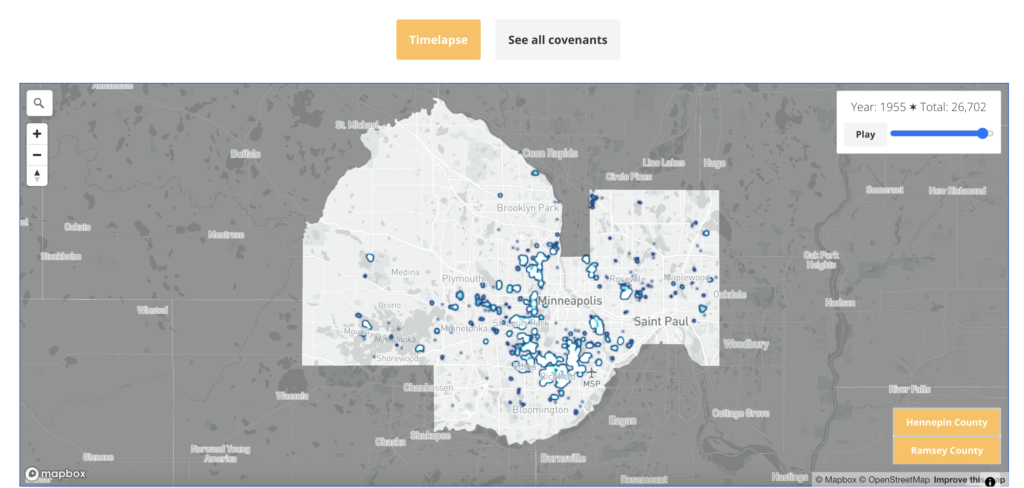
Data collected was presented using Mapbox. This interactive tool allows users to zoom in on specific portions of Hennepin and Ramsey counties, where racial covenants were prominent. The “timelapse” feature displays where racial covenants were located between 1910 and 1955. This feature allows users to analyze patterns such as which years there were changes in the rate of racial covenants being used and how the use of racial covenants in specific neighborhoods affects the demographic makeup of the Twin Cities today. Data for this project is also available in the form of downloadable shapefiles, spreadsheets, and maps.
After breaking down the project, a question that arose for me was how Digital Arts and Humanities projects shift the way researchers and historians analyze data?
1 thought on “Reverse Engineering Mapping Prejudice”
Comments are closed.
Wow, this is so interesting! I’ve never seen somebody try to map gentrification before. I grew up in the San Francisco Bay Area, which has become increasingly gentrified in the last few decades. Sometimes it feels like I can see the gentrification happening there before my own eyes. So, this is super interesting to see an actual, tangible map of it! I think the time lapse feature is also super helpful for visualizing the data.