The Corruption and Reform project introduced a piece of history in the 19th century in Grand Rapids, Michigan. Corruption over the city’s water supply construction blossomed in public. Several city elites were caught in the middle of the scandal. This incident also provided an atmosphere for reforming the city’s commissioner-manager system.
The project provides visualized mapping data for the social and political elites and the headquarters of influential social organizations like banks and women’s clubs. Spatial analysis shows that the most influential elites and organizations and the main actors in bribery and corruption were in the same neighborhood.
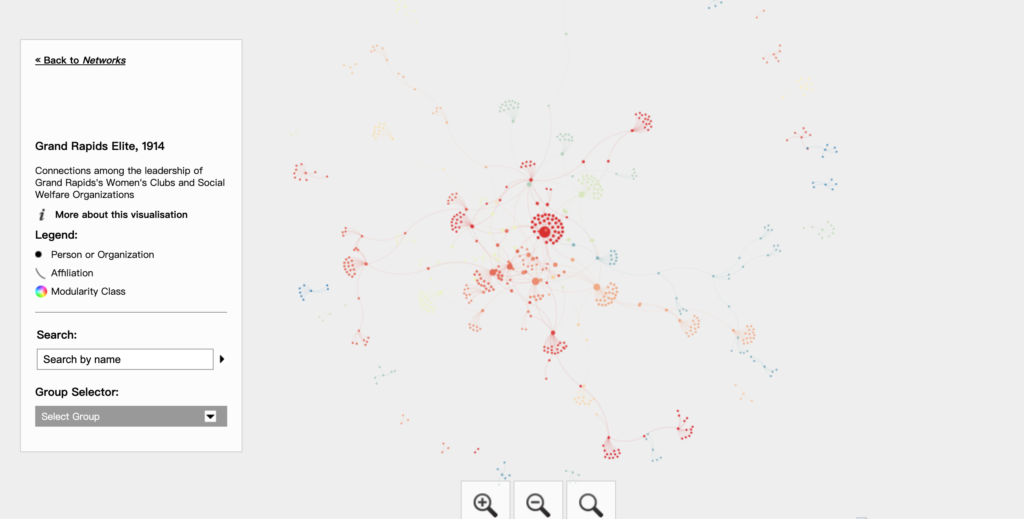
The project also analyzed the social networks of the elite in Grand Rapids. In the layout, the nods are the people and the organizations like banks, women’s clubs, social welfare, and organizations, and the edges indicate affiliation relations. For example, in the Women’s Clubs, 1914 layout, two nodes connect to the node representing Mrs. Leonard Heyboer, the GR Federation of Women’s Clubs, and the Igdrasll Club. Mrs. Leonard belongs to both clubs. When we put all the layouts together, we can easily see that the social network is very complicated. The project team determined the sizes of the nodes by eigenvector, which was very similar to the technique I learned in linear algebra class. With eigenvector, we can easily see the importance of the organizations and the people. When one has more connections with others, they will have a larger size on the layout.
I think the interaction of this project is fantastic. I can see the connections between people. I can also see the details of the relations if I click on a node. Besides this, I think the sizes of the nodes can be more significant. They can also increase the thickness of the edges.Another thing I think would help the user better understand the social network is the color of the nodes. The project team colors the nodes based on modularity classes. Views can better understand the reform network if they can determine the colors based on the party membership.
4 thoughts on “Reflection: Corruption and Reform”
Comments are closed.
This project seems very well organized and intuitive. It was interesting to learn about the roles of eigenvectors as well.
I like how easy this network is to follow. The use of size and color to convey information really helps the viewer. Like Alex, I think it is also really interesting to hear how eigenvectors were used. It is really cool to look at this information and know on some basic level how it was computed/created mathematically.
I thought this was a pretty compelling use of Network analysis. It is a shame though that the interface is a little clunky. There is clearly a lot of information available, but It isn’t immediately clear how to interpret that data. I would have liked if the project more clearly displayed its procedure and conclusions.
You gave a really detailed analysis of the project. I think the spatial analysis (on how influentiality & corruption correlates for neighborhood) is especially interesting. I like with your point that the choice to color the node would be helpful! Agree with Alex that it’s interesting to learn about the role of eigenvalues.