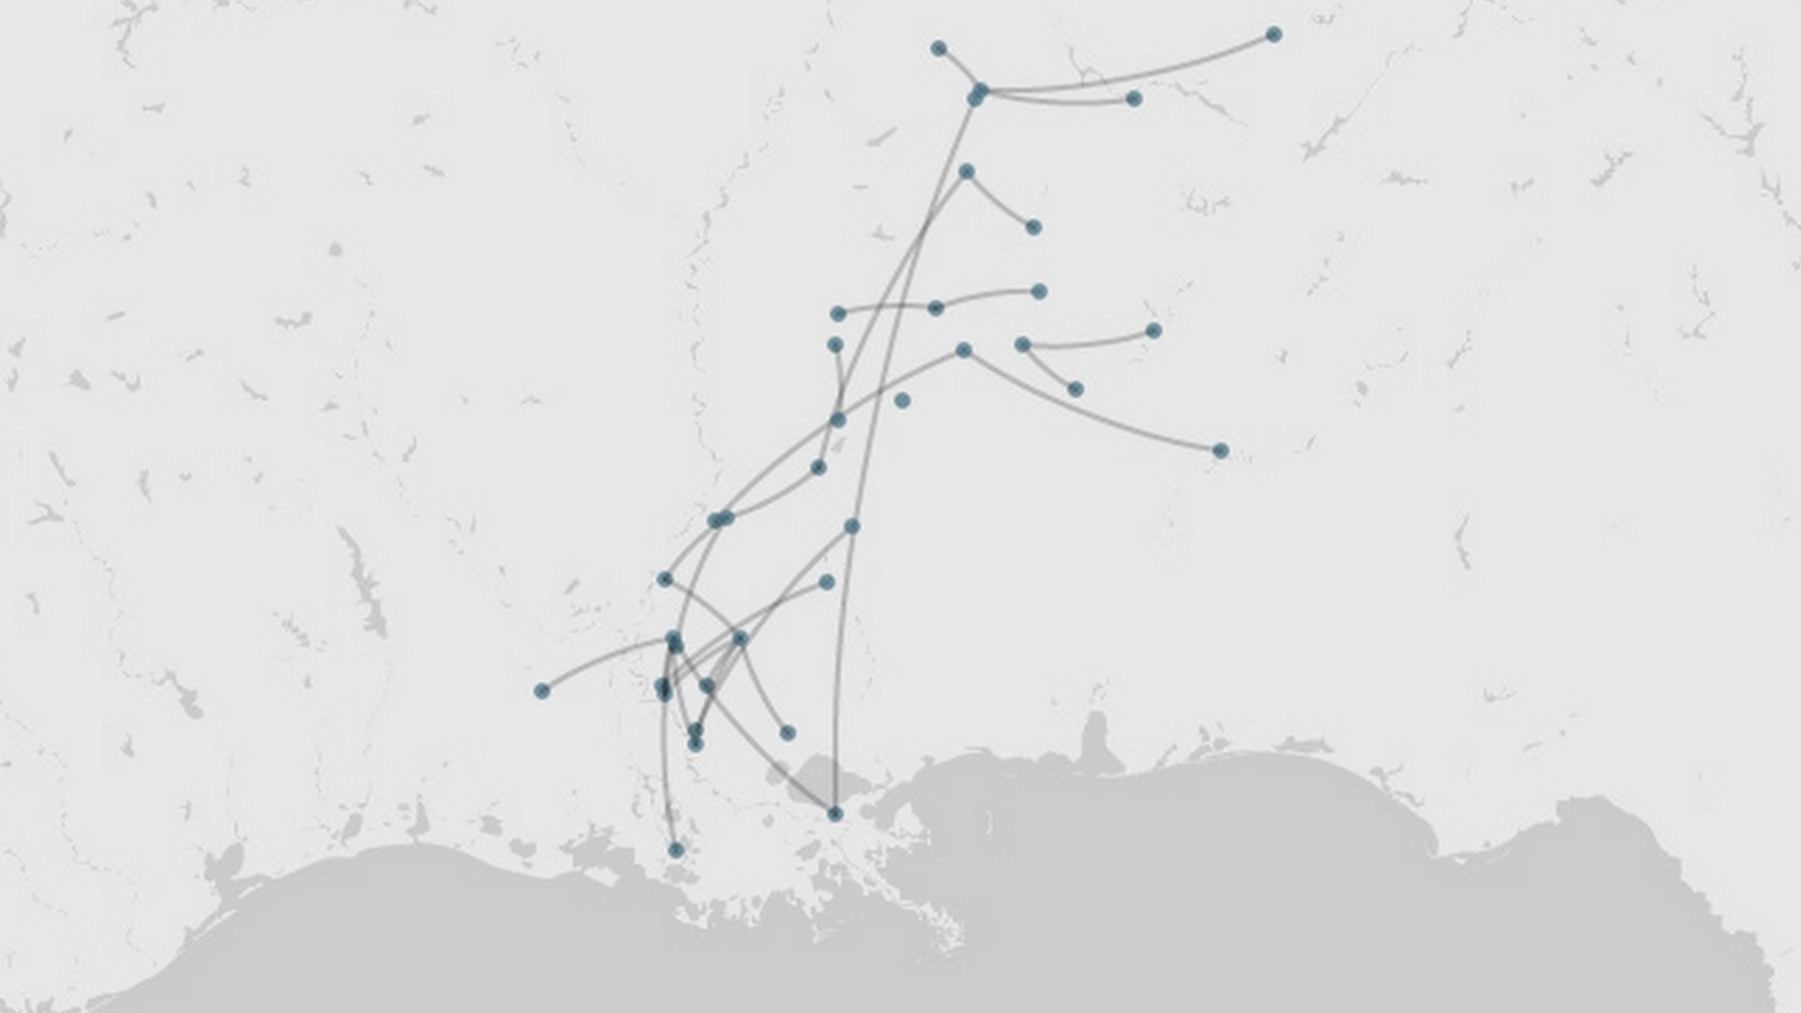
In 2014, a group of scholars at Rice University used the Geographic Data Visualization tool, Palladio, to depict the paths of runaway slaves. To acheive this, the scholars acquired jailers’ advertisements (notices sent to slave owners) which provided both the location of jails holding captured slaves and the runaway’s original location. They used two data sets; ads sent through Bexar County Jail in Texas, Pulaski County Jail in Arkansas, and Jefferson County Jail in Mississippi from “the late 1850s”. The other data set included “all jailers’ notices advertised in each state over the years 1840 to 1842”. The researchers then created two spreadsheets: one where they input all of the location data provided from the ads, and the other stored the coordinates for each location. The coordinates allowed for the creation of the map as, unlike the coordinates, location descriptions are not readable by Palladio.
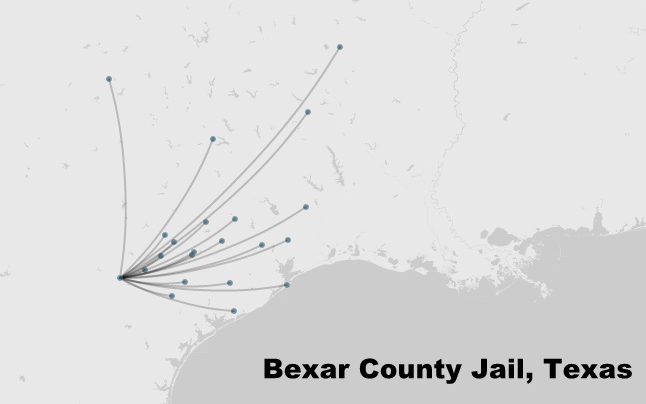
With this data, the scholars were able to place each location as nodes on a map of the slaves’ region. The edges connecting the nodes showed their predicted path, begining at individual nodes (runaways’ original location) and converging at the single jail node. Further into the project, the researchers used the “Count by” function on Palladio. This allowed each node’s size to change depending on the data frequency pertaining to each node. This was especially uselful when using the data set of all the jailers ads from each state, 1840 to 1842.
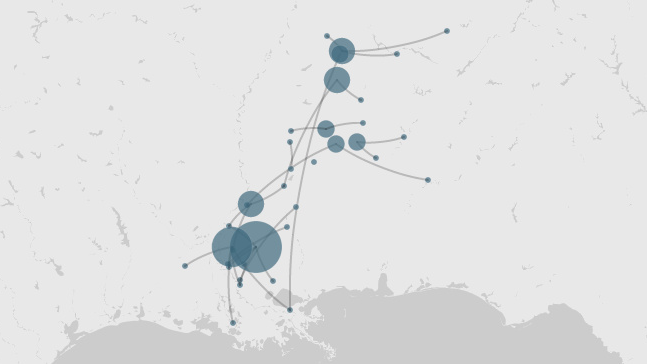
As can be seen, the enlarged circles show increased traffic in specific locations. There are, of course, some things that this project could benefit from. For example, nodes colored differently depending on the type of location (origin or jail) would make the data easier to understand. The scholars themselves stated that something as simple as arrows would make the visualization more intuitive. However, Palladio might have limited graphic capabilities. This was an interesting project nonetheless.
3 thoughts on “Visualizing Slave History”
Comments are closed.
That map is such a vivid presentation of paths using graphs! I am surprised that the locations of nodes are detailed to the address of jails rather than, for example, some centroid of states. I also think that altering the size of nodes based on population is a great idea for visualizing the data. I would be interested to see what determines how the edges are curved (towards one side rather than the other).
I like your idea of adding color to the nodes to represent whether the node was a start or stop location. This would tell a better story in the visualization. It’s honestly a shame that Palladio didn’t even have this functionality at the time. It was cool that this project experimented with a new tool, but considering the fact that data visualization is a science and an art that has so much depth to it, I wonder if the novelty of Palladio is worth the sacrifices the user makes in limited flexibility in their visualization.
That project is an excellent use of connecting network graphs to real geography, which I find interesting in how it contributes to different understanding of what a network graph typically is, in relation to location of the nodes. I do agree with your point that collaboration between spreadsheets and Palladio was valuable, but the limitations of Palladio with regard to color do weaken the visualization.