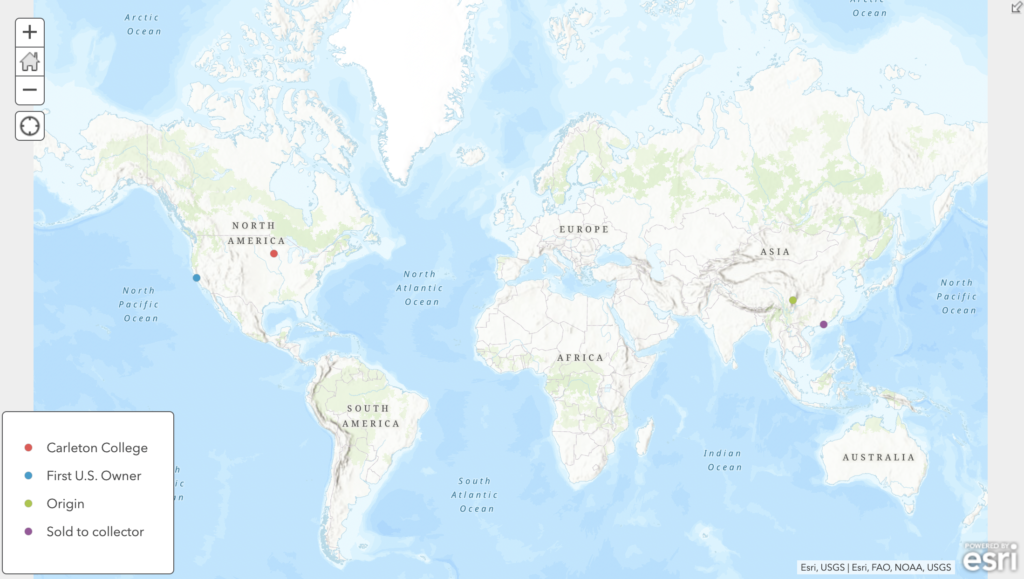
We are working on a project together with the Pearlman Teaching Museum in class. In it we 3D modeled and studied an Ancient Chinese statuette. As part of our studies, we mapped the trajectory of the object until it arrived in our museum. We were given information about where it was originally made, where it was sold to its previous owner, where it first stood in the US, until it, finally, arrived here in Carleton. We were also given information that can help identify the object like its ID, name of the object and dimensions. We formatted the information we had about the item in a CSV so all the information was the same, except for the dates it was produced/acquired by a new owner. With a few clicks, we uploaded the information online and ArcGIS accurately pinpointed each activity in the map. Even though part of the information was vague (we used ‘Central Hong Kong’), the tool correctly identified the places and with a few clicks to adjust the labels our map was done.
ArcGIS is a wonderful tool to be used for digital humanities projects which demand spacial visualization. More than using one’s own CSV formatted dataset the site also allows you to use information collected by other users (some of which is collected by universities and governmental agencies, which makes them very reliable), add multiple layers, change labels, and other functionalities. This allows one to find correlation between many different datasets (which may or may not be original) such as location of Starbucks and Caribou in America. What is more it is possible to include the final map on the project’s website or paper. ArcGIS creates a visually pleasant and intuitive, as seen bellow for the result of our group: