If one were to use a map to study the spread of COVID-19 over time they would see that most cases from December, 2019 are in China. However, in the next few months, the virus arrived at other countries, such as Japan, Italy, Spain and the USA. Having a single map with all the reported COVID cases would not be helpful, as it does not report the progression of the virus over time. Similarly, if we had a different map for every day (or month), it would be overwhelming and a hard to compare. In order to solve this problem and others of the same type, we can use a slider, which enables us to see how information changed over time. With this tool the map only shows the information within the desired time interval.
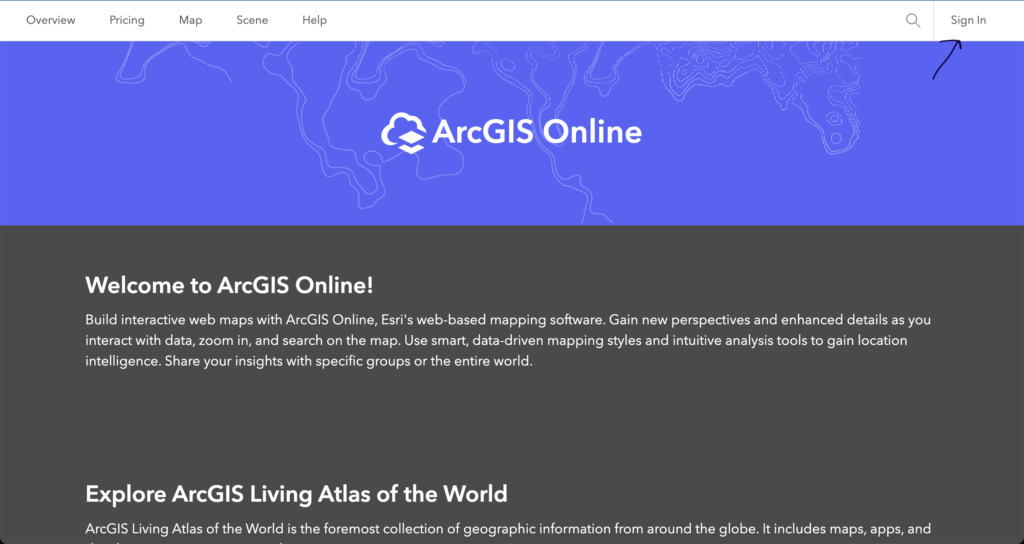
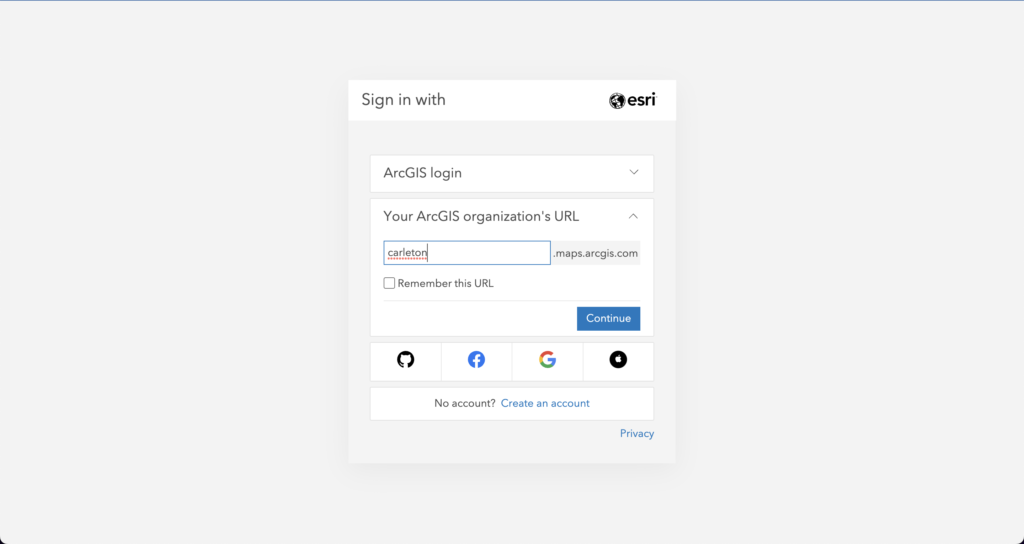
To Create a slider, go to ArcGIS Online, and log in to your Carleton account.
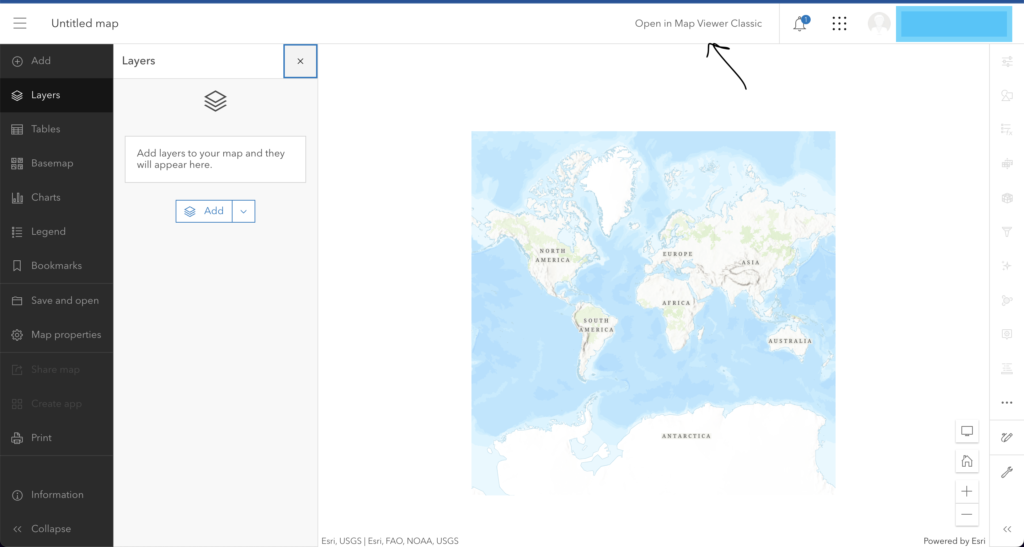
Once you are logged in click on map, and then click on Open in Map Viewer Classic
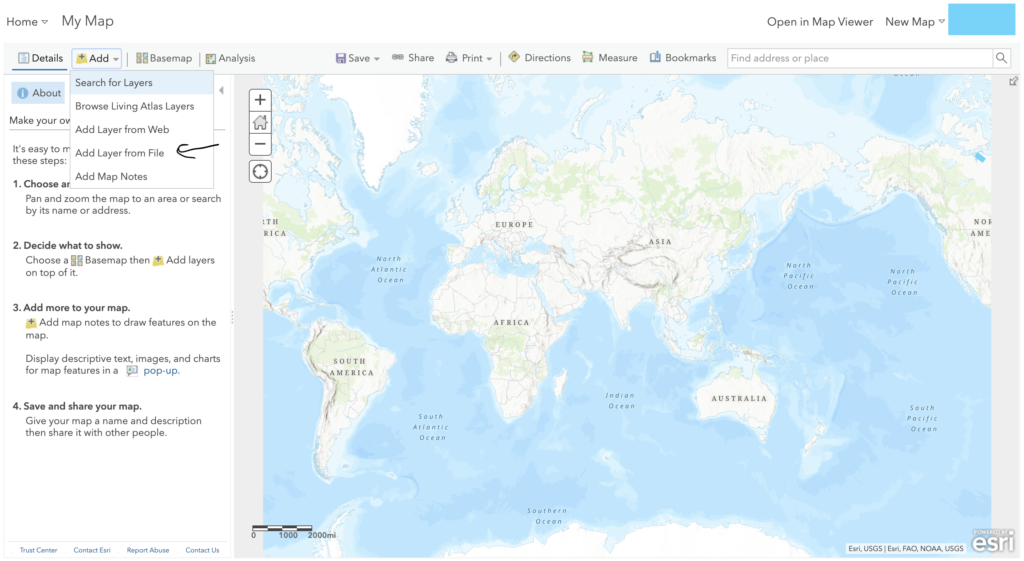
On the add menu, select the option add layer from file:
Then Click on choose file and select the file you want to upload:

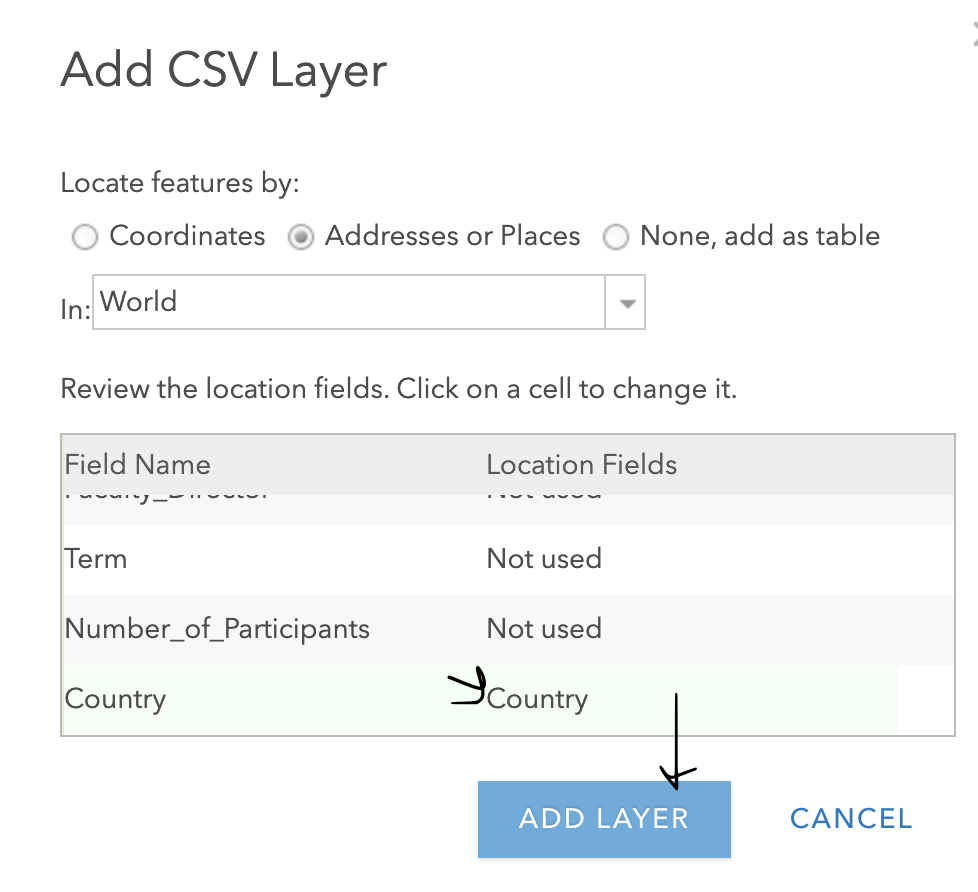
Your dataset needs at least three fields: start date, end date, and something outlining the location (it might be Country, City, State, latitude and longitude, among others). However, the Start Date and End Date fields must follow a few standards. That’s the format I used for my dataset

Once you have chosen your dataset, make sure the map is correctly picking up the location field of your file and click on Add Layer:
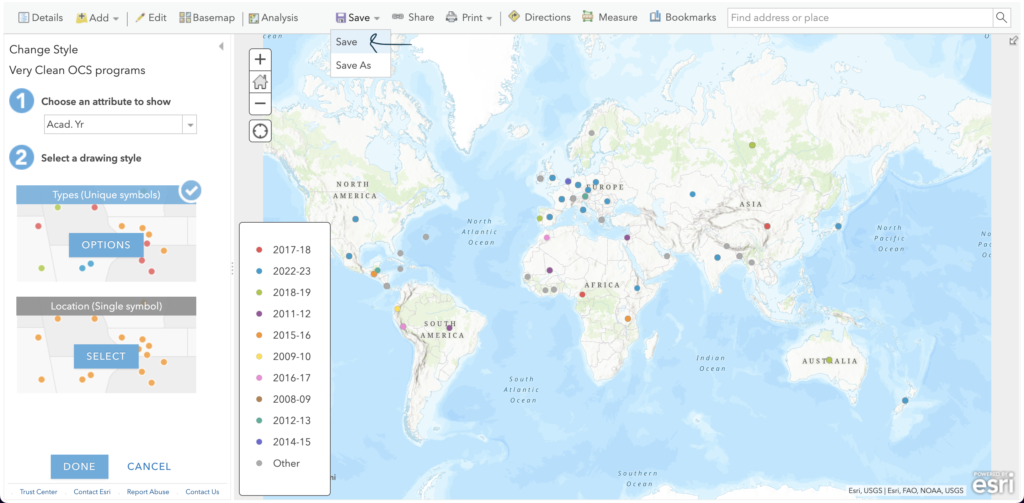
It is really important that you save your map.
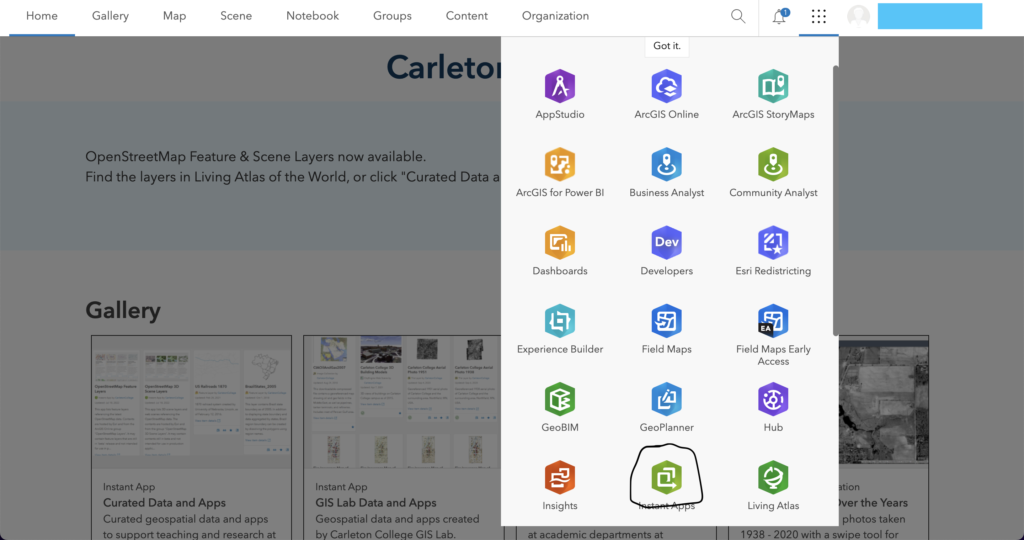
Then go back to the home page and click on the Apps icon on the top right corner of your screen, which should be on the right side of your name and profile picture. Then scroll down and click on instant apps.
In the search bar on the top left part of your window type ‘time slider’ and press enter.
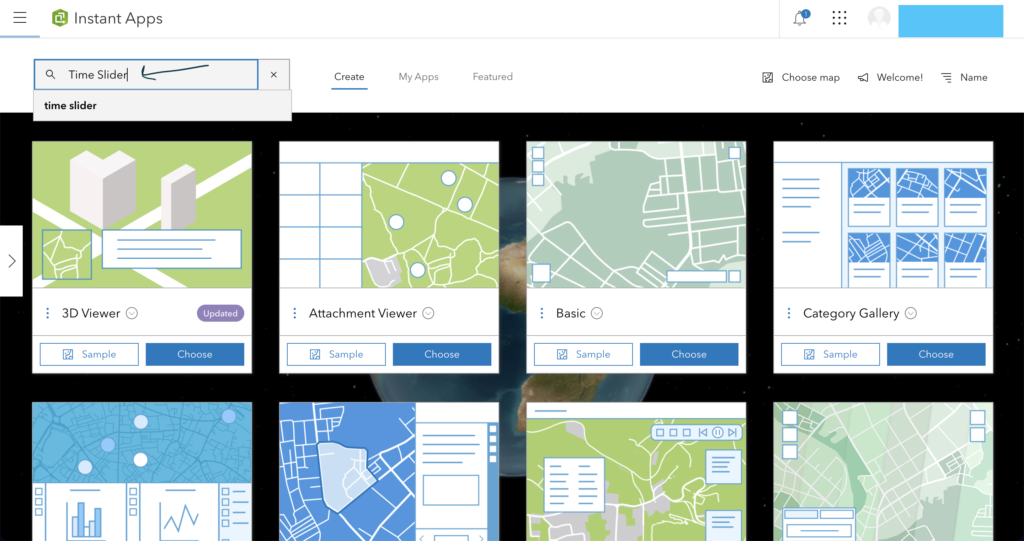
Select the following link:
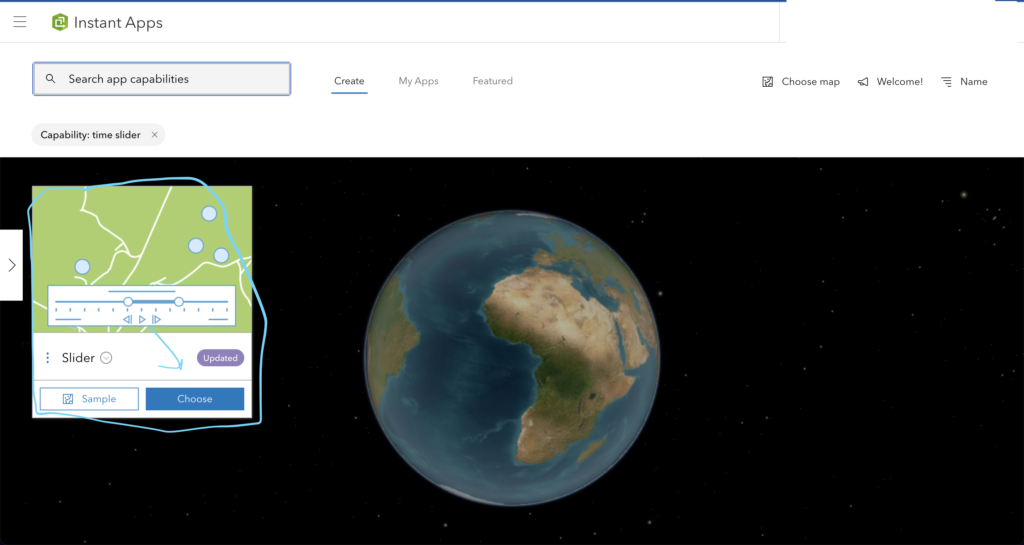
Now, all you have to do is choose a random name and tags for your map, click on create map, and you will be redirected to a configuration page. In it click on map:

Now click on select map and choose the map you have just created with your external file.

Now, click on next and select time:
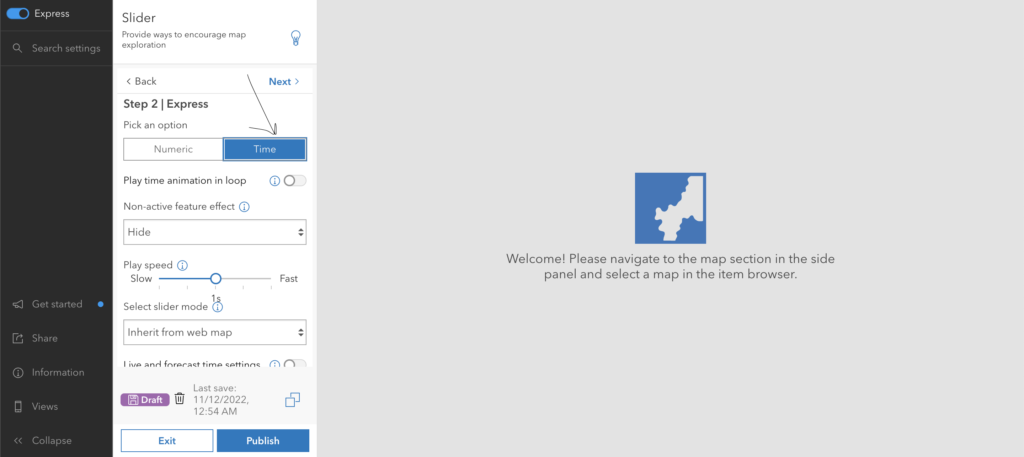
After that is done, click on publish and your result will be a map with a slider to control the displayed time interval. For demonstration purposes, I used the default ArcGIS default map which looks nicer.

For further reading use on the subject use this link, and for possible troubleshooting, use this link.
3 thoughts on “Create a Slider on ArcGIS”
Comments are closed.
I really appreciate how you included more steps than necessary for this tutorial. When I had tried to do this for a midterm I had a really hard time including the dates both in this aspect and the web map that I created. The challenge also included getting the dates in the right format which was hard, but more of an excel problem than ArcGIS.
Sliders seem like a powerful tool for displaying information on a map. I was wondering, If you use the “numeric” option instead of “time”, Can you use that with different types of data points? For example if you wanted to use a percentage from survey data, could you use a slider to view how regions change in response to that percentage.
I like the idea of slider to show progression in time. It’s similar to the example of a “4 dimensional” data visualization that we encountered in class a few weeks ago which depicted nuclear bombs as they were happening in space AND in time. However, your example is more interactive in the sense that the user needs to use the slider in order to make the change happen. I also like that at the start you mentioned how such a tool definitely improves the user’s experience.